


过去的研究发现,土壤中添加生物质炭对土壤碳既可以表现为正激发(加快土壤有机碳的分解),也可以是负激发(减缓土壤有机碳的分解),或者无激发(不影响土壤有机碳的分解)。然而,却不清楚为什么出现这种情况,即哪些因子在控制生物质炭的激发效应。
沈阳农业大学的丁凡博士与澳大利亚大学新南威尔士基础产业部的Lukas Van Zwieten教授合作,从过去27个室内培养的研究中搜集了1170组数据,利用增强回归树模型(Boosted regression tree)来解析不同因素对生物质炭的激发效应的贡献。
结果表明: 室内培养条件和生物炭性质对生物质炭激发效应的影响大于土壤性质。对生物质炭激发效应影响较大的因子是培养时间,土壤湿度,生物炭C/N和N含量,制备生物炭时的热解时间和土壤质地。正激发效应多发生在室内培养的前2年,之后转变为负激发效应。 低N生物炭或土壤湿度较高时多表现为负激发效应,反之则表现为正激发。并且,生物质炭产生负激发的程度随生物炭C/N,热解时间,土壤粘粒含量增加而增加,但随土壤C/N增加而降低。此外,作者还分析了生物质炭产生正激发和负激发效应的机质。
研究成果于2017年12月22日发表在《土壤与沉积物期刊》(Journal of Soils and Sediments)上。论文第一作者和通讯作者是沈阳农业大学的丁凡博士。
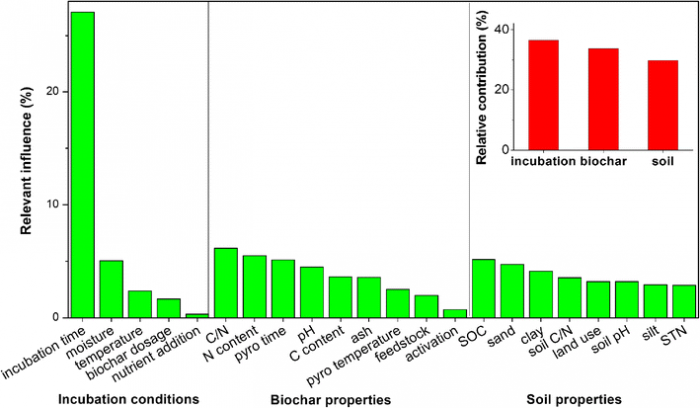
Fig. 1.Percentage relative influence of factors on the priming effect following biochar amendment. The inner figure showed the comprehensive influence of incubation conditions, biochar properties and soil properties
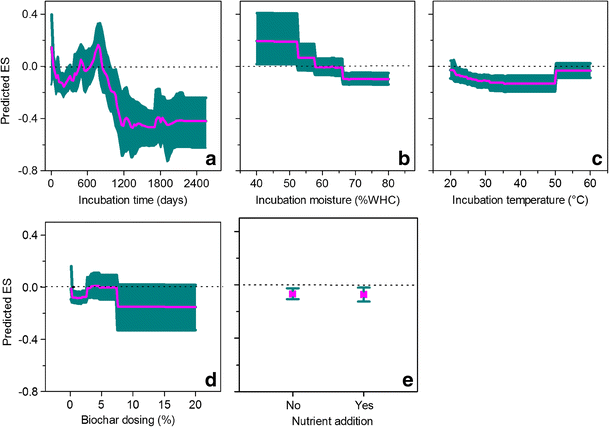
Fig. 2. Partial dependence plots showing the variation in biochar priming effect by incubation condition variables used in the BRT model. a Incubation time. b Incubation soil moisture. c Incubation temperature. d Biochar dose (% dried soil weight). e Nutrient addition or not. The fitted function shows the relationship between ES and an explanatory variable while all other explanatory variables are kept constant at their mean level. The shading shows the 95% confidence intervals estimated, and the vertical bars show the standard deviations, from 500 bootstrap samples of the data set. The horizontal dashed line represented a predicted ES value equal to 0
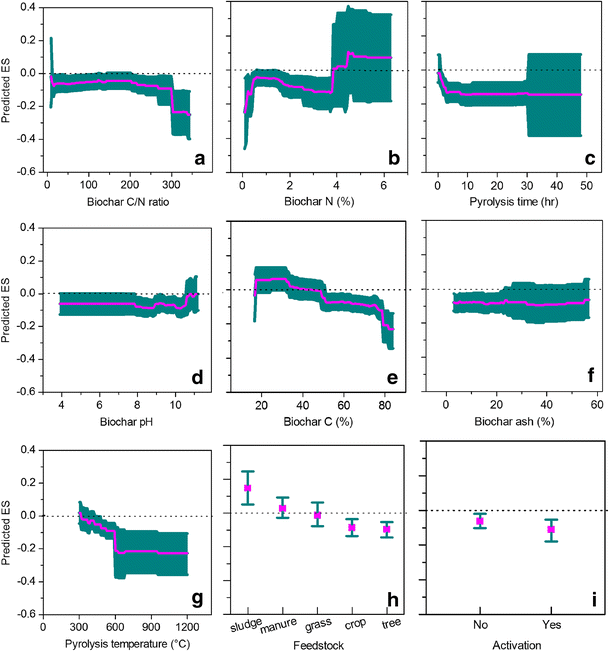
Fig. 3 Partial dependence plots showing the variation in biochar priming effect by biochar properties used in the BRT model. a C/N ratio. b Biochar nitrogen content. c Pyrolysis time during biochar production. d Biochar pH. e Biochar carbon content. f Ash content. g Pyrolysis temperature during biochar production. h Feedstock types. i Whether biochar was activated. The fitted function shows the relationship between ES and an explanatory variable while all other explanatory variables are kept constant at their mean level. The shading shows the 95% confidence intervals estimated, and the vertical bars show the standard deviations, from 500 bootstrap samples of the data set. The horizontal dashed line represented a predicted ES value equal to 0
论文全文请见:https://rd.springer.com/article/10.1007/s11368-017-1899-6
