联系我们
意见反馈

关注公众号

获得最新科研资讯

Transport Phenomena at Micro/Nanoscale

简介 Dr. Zhibin Yan

分享到
实验室简介

Our overarching research goal is to explore the transport phenomena at Micro/Nano scale, centering on four keywords: Colloidal Physics, Energy conversion, Point-of-care Testing, Electronics cooling. My research efforts aim to diagnosis disease immediately, and optimize the design of microchannel heat exchanger and high performance thermal management system for 5G communication base station.


We are looking for high-motivated independent researchers, undergraduate students, graduate students, and postdoc. Please use this link for your application

还没有发布内容

Colloidal Physics:Study on reversible assembly mechanism of micro-nano particles

Figure1.  (a) Schematic illustration of the surfactant molecules absorption on PS particles. (b) Schematic of the experimental apparatus, inset: force vectors for the EHD drag force, van der Waals force, electric double layer force and depletion force induced by surfactant micelles (not to scale). The particle assemblies formed on the top electrode surface are not drawn for simplicity.


Figure2. (a) Representative fluorescence microscopy time-lapse images of 1 µm diameter PS particles suspended in three different liquid media (DI water, 0.1 mM SDS, 0.1 mM CTAB) at different times near the bottom electrode surface. The superimposed green points mark the particle centers, and the green lines depict the connection to the nearest neighbors, as calculated via Delaunay triangulation. The electric field is applied at t = 0 s and the time-lapse images were taken for 300 s after the application of an oscillatory electric field of 1.09 × 10⁴ V m1 and 400 Hz. All the picture scales are 3 µm. (b) Normalized interparticle separation distance (d/2a) as a function of time for three suspensions. (c) Normalized interparticle separation distance (d/2a) after applying the oscillatory electric field for 300 s in three suspensions. (d) Number of particles forming the assembly as a function of time for three suspensions. Error bars are two standard deviations of the mean of three trial replicates.


Figure3. Representative fluorescence microscopy images of 1 µm diameter PS particles suspended in SDS (a) and CTAB (b) solutions with different concentrations (0.001 mM, 0.01 mM, 0.1 mM, 1 mM, 10 mM) near the bottom electrode surface, taken at 300 s after the application of OEF of 1.09 × 10⁴ V m1 and 400 Hz; normalized interparticle separation distance (d/2a) as a function of time and after applying the OEF for 300 s in SDS (c), (e) and CTAB (g), (i) with different concentrations; orientational bond order parameter (Ψ6) as a function of concentration of SDS (f) and CTAB (j); number of particles forming the assembly as a function of time in SDS (d) and CTAB (h). Error bars are two standard deviations of the mean of three trial replicates.


Articles:

    Lisha Luo, Zhibin Yan*, Minqi Yang, Hongjie Yin, Mingliang Jin, Huicheng Feng, Guofu Zhou, Lingling Shui*, Two-dimensional colloidal particle assembly in ionic surfactant solutions under an oscillatory electric field, Journal of Applied Physics. 2021, 54, 475302.

Energy conversion:Photothermal effect of metal plasma structure on the surface of nanoparticles

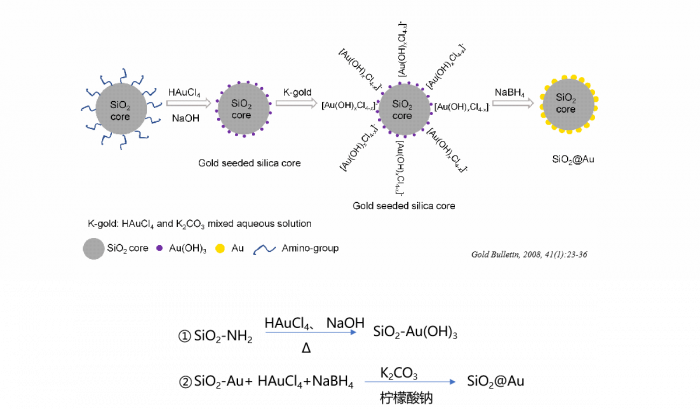
Figure1. Synthetic procedures of the SiO2@Au core–shell nanoparticles. We study the effects of the morphology of gold clusters on the surface of SiO2@Au core–shell nanoparticles on their photothermal conversion performance by changing the amount of gold salt, the pH value of the growth solution, and the volume and concentration of the reducing agent used in the chemical synthesis of SiO2@Au.

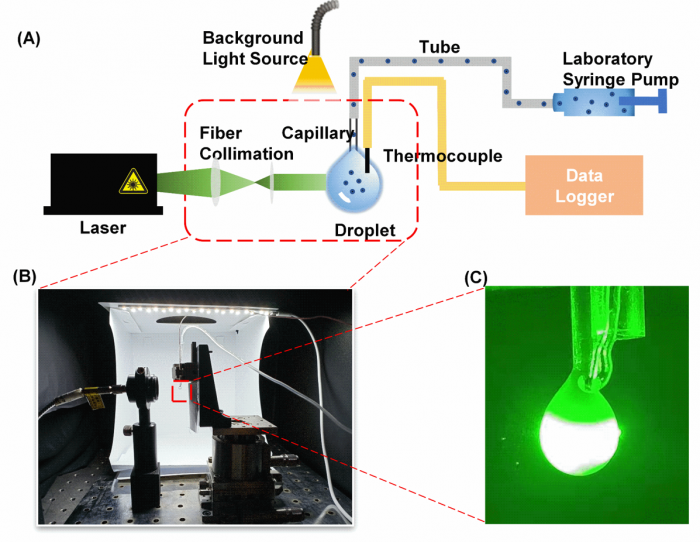
Figure2. Photothermal effect testing device: (A) Schematic of the experimental setup for characterizing the photothermal performance. (B) Photo of the experimental setup. (C) An image showing the laser passing through the droplet.

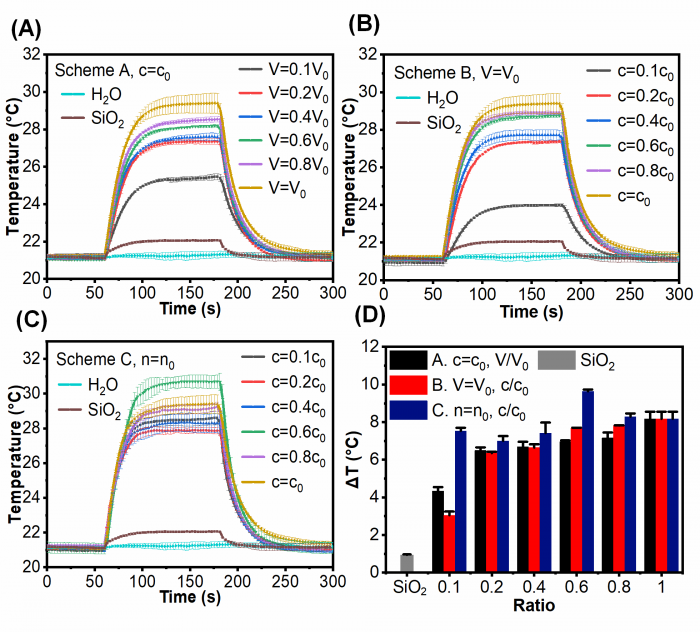
Figure3. Temperature evolutions of Scheme A (A), Scheme B (B) and Scheme C (C) under laser irradiation. The power of the laser was fixed at 53.6 mW. (D) Temperature rise after 120 seconds laser irradiation of Schemes A, B and C, and the abscissa represents the ratio of c/c0 or V/ V0 (volume ratio of K-gold to seed: 80 : 1 and pH ¼ 10.31, V0 ¼ 4 mL and c0 ¼ 6.6 mM of NaBH4).

Figure4. The influence of NaBH4 participating in metallization of gold-seeded silica nanoparticles. (A) The TEM images of SiO2@Au with different volume of NaBH4 at V ¼ 0.1, 0.2, 0.4, 0.6, 0.8, 1.0 V0 (i–vi) while keeping concentration constant, and (B) the corresponding UV-Vis absorption spectra for Scheme A. (C) The TEM images of SiO2@Au with different concentration of NaBH4 at c ¼ 0.1, 0.2, 0.4, 0.6, 0.8, 1.0 c0 (i–vi) while keeping volume constant and (D) the corresponding UV-Vis absorption spectra for Scheme B. (E) The TEM images of SiO2@Au under different concentration of NaBH4 at c ¼ 0.1, 0.2, 0.4, 0.6, 0.8, 1.0 c0 (i–vi) while keeping amount of substance constant and (F) the corresponding UV-Vis absorption spectra for Scheme C. (volume ratio of K-gold to seed: 80 : 1, and pH ¼ 10.31, V0 ¼ 4 mL and c0 ¼ 6.6 mM of NaBH4).


Articles:

Lulu Yang, Zhibin Yan*, Lu Yang, Jianxin Yang, Mingliang Jin, Xiaobo Xing, Guofu Zhou and Lingling Shui*, Photothermal Conversion of SiO2@Au Nanoparticles Mediated by Surface Morphology of Gold Cluster Layer, RSC Advances 2020, 10, 33119-33128

Point-of-care Testing:Hybrid paper-based digital microfluidic detection chip

Figure1. We fabricated paper-based EWOD devices using cellulose paper as substrate and paraffin wax as dielectric hydrophobic layer, which have been widely used in fabrication of continuous-flow µPAD. The cellulose paper was firstly densified via being pressed under different pressures to reduce the surface roughness and internal void volume. The paraffin wax film was fabricated via two different approaches, including melting method and spray-coating method followed by thermal annealing treatment.

Figure2. BNP quantitative detection of HPDMF chip.


Articles:

Patent:

访问量:340